Monitoring Usage
You can get a detailed, per-device report, of Octave usage since your device(s) first communicated, via the Usage screen in the Octave dashboard (accessed by selecting Deploy & Monitor > Usage). This information includes which devices were active and how many messages were sent/received for a given date range. Viewing this information can be useful for understanding Octave your billing costs.
Filtering the Usage View
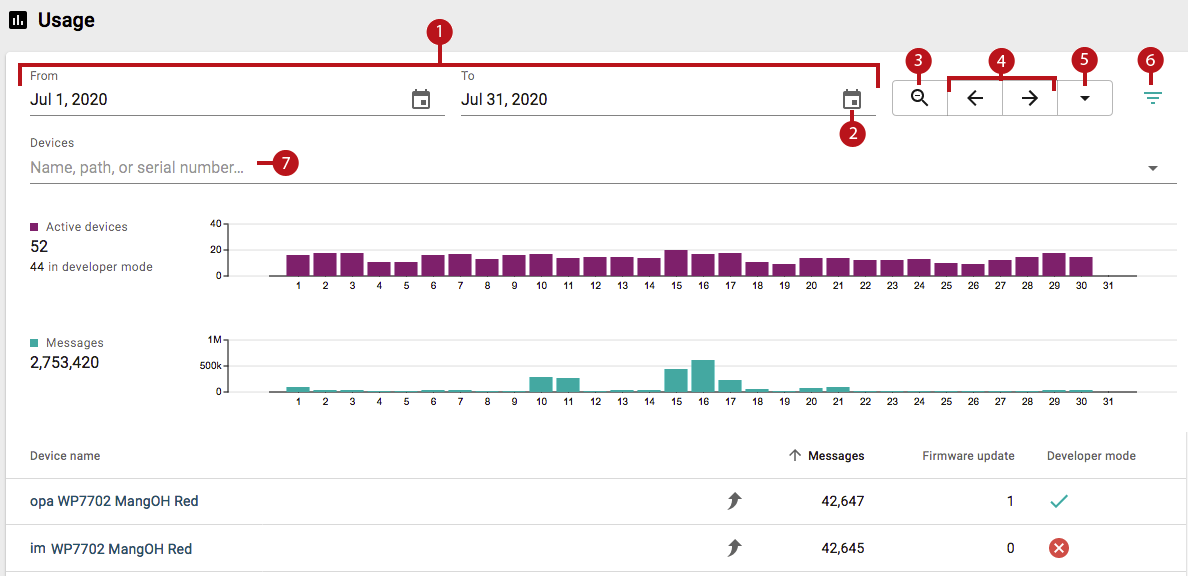
The Usage screen features filtering options that allow you to view the number of active devices, number of messages, and the devices in use for different time ranges:

- Allows you to specify the start and end date of the time range to view.
- Displays a calendar selector through which you can specify the date for the start or end of the range.
- A zoom-out button that gradually widens the range from day to month, and month to year.
- Shifts the date range by the number of days in the current range. For example, if the current date range covers the current calendar year and the right arrow is clicked, the date range will change to be the next calendar year. If the current date range covers the 15 through the 20th day of the current month, clicking left will shift the range backwards by 5 days so that the range is from the 9th through the 14th day of the current month.
- Provides common, pre-defined date ranges (e.g., the current month).
- Displays the device filter (7).
- A device filter in which you can specify one or more devices for which to display usage by device name, path, or serial number. By default, usage is shown for all devices.
Viewing the Usage
The usage screen allows you to view and drill down on various aspects of usage:

- Displays the total number of devices that were active in the selected time range, including the number that were operating in Developer Mode.
- Displays the usage for a specific day in the current range. Hovering the mouse over the bar for the day lists the total number of active devices for that day. Clicking on the bar filters the graph so that it only displays information for that day.
- Displays the total number of messages for the active devices, for each day in the range.
- Displays the number of messages for a given day. Hovering the mouse over the bar for the day lists the total number of messages for that day.
- Adds the device to the filter field (7).
- Lists the total number of messages sent/received for the device in the current range.
- Clicking on the device name redirects to the device detail page.
Updated over 4 years ago
